Texas Rangers boost attendance and optimize marketing spend with 360-degree view of ballpark operations
Boosted game attendance on targeted weekdays
Maximized promotional spend and media buys
Reduced seasonal temp staffing costs by $40,000
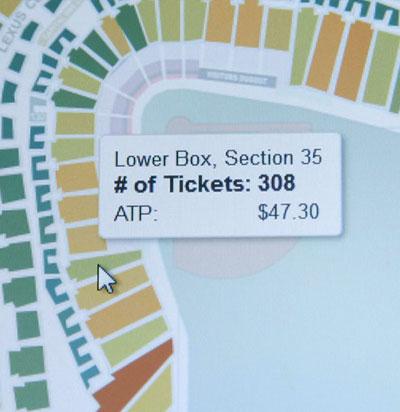
Globe Life Park in Arlington is home for the Texas Rangers. It’s also one of the largest baseball stadiums in the world, serving upwards of 49,000 fans at every game. While fans arrive enthused to watch grand displays of athleticism by their team, the unseen heroes work behind the scenes in ballpark operations. From Advertising, Marketing, and Information Technology, the Texas Rangers front-office team uses Tableau to create a 360-degree view of operations for 82 home games a year. By tracking real-time ticket purchases, food and beverage sales, and merchandise sales in Tableau, the team can collaborate quickly on daily business decisions that help prioritize resources, enhance savings, and hit a front-office home run.
With our real-time analytics, we're able to do things like make staffing decisions on the fly. Tableau has really helped us understand how to better use the resources that we have.
Disparate data rolled into one, 360-degree view
The Texas Rangers front-office team was eager to find a collaborative solution that would bring multiple spreadsheets and data sources together, from food to ticket to merchandise sales.
“Each department kind of made their own spreadsheets. So I would take some sales data and make my own version of what I thought I wanted to see,” said Becky Kimbro, Vice President, Marketing.
With all of this disparate data, making informative and impactful business decisions in real time, across the organization, was almost impossible. But Becky’s colleagues, freshly empowered by Tableau’s ability to bring multiple data sources together into one view, decided to create an internal “Analytics Task Force.” Their first big project: tackle ticket sales.
"Hey, let's get ahold of this ticketing data, and let's present it in a manner that almost anyone can interact with,” said Sarah Stone, Manager, Advertising & Marketing.
The result is a multifaceted operations team with a holistic view of their ballpark and how it functions.
Today, with a Tableau Desktop and Server solution, employees can access data and share dashboards across teams.
Sarah shares how this creates a culture of collaboration: “One thing that's been successful in our organization is going to the box office or to ticket sales or to accounting and saying, "Let's sit down with your data. We're all working for the same baseball team. We're all trying to sell tickets and help the team win. You can make a dashboard too."


We launched this particular ticket special four days before the game and we were able to see real-time performance.

Tracking marketing spend for short-term ticket specials
With Tableau, ballpark operations teams determined that 10 days leading up to the game, including game day, accounts for about 50% of all individual ticket sales.
When games aren’t selling well, the marketing team looks to dashboards to discover why they might be falling short of their goal. Sarah provides the example of a Father’s Day game: “On this particular Father's Day, it was the last game of a really long home stand, which is traditionally a little bit harder to sell. It was kind of a special holiday, which can sometimes be difficult to sell.”
About a week before the game, the marketing team got together to strategize on how to sell more tickets.
Sarah recalls, “We launched this particular ticket special four days before the game. And then we were able to see in real time what the performance of the special was.”
In Tableau, the team could see track the whole spectrum of marketing activities and how they were impacting sales—from earned media to social media.
“This has allowed us to put together kind of a template for launching these short term ticket specials. And that really is one of the more valuable things of all of our efforts.”


Reducing staffing costs during rain delays
The team valued the impact on promotions and sales so much, they looked at other ways to leverage their ticketing data. They opened their ticketing data to other business groups from the box office to human resources. “Thanks to Tableau, we could present it in a manner that almost anyone can interact with,” said Sarah.
And it paid off. For instance, the team looked to Tableau to understand the effects of rain delays. They found that after rain delayed a game, ticketing data showed not a single ticket was sold for 15 minutes. The decision was made to shut down 75 percent of box-office windows, saving staffing costs for the day. The team can continue to monitor this data over time to understand trends and take action accordingly.
“With our real-time analytics, we're able to do things like make staffing decisions on the fly,” added Becky Kimbro, Vice President of Marketing. “Tableau has really helped us understand how to better use the resources that we have.”
Tableau gives people the ability to actually know the exact numbers behind things. I know the number of people that are coming. I know the number of people that have bought a certain ticket special. I know the next day we have a cap giveaway, so more people might be buying for that game.
Marketing discovers increased sales from bobblehead promotions
In the world of baseball, promotions and giveaways are baked into the culture of the game experience. With Tableau, the Texas Rangers’ marketing team looked at the history of attendance over the previous five years to understand how promotions—like bobbleheads, t-shirts, or fireworks—impacted ticket sales.
When looking through the data from bobblehead nights, the team realized that attendance peaked on Tuesdays, not Fridays or weekends as they originally assumed.
“We said, "Oh, my gosh, these things are really moving this day of the week that people didn't normally buy,"” said Sarah. “So we then thought, let's try to put another bobblehead in the schedule at the end of the season.”
As a result, they added a Yu Darvish bobblehead night at the end of September, where they saw an incremental increase of ticket sales for the game. This was just the start of the team’s data journey.
“Tableau gives people the ability to actually know the exact numbers behind things. I know the number of people that are coming. I know the number of people that have bought a certain ticket special. I know the next day we have a cap giveaway, so more people might be buying for that game.”