Arguably, more than any other department, IT knows the value of data and the value of being data-driven. IT systems collect and store data for the organization, but you also use data every day to manage, monitor, and maintain a multitude of platforms to support business needs, which creates the perfect opportunity to analyze this data with Tableau. Tableau connects disparate sources of data to provide you with a complete picture of your business. The platform provides data access, data prep, analytics, and API capabilities that are especially useful when aggregating multiple sources of data to centrally manage all your infrastructure, whether it exists in the cloud, in applications, in log files, or in traditional databases. Tableau provides both choice and flexibility to leverage existing technology investments across your heterogeneous environment. See how Tableau enhances your business through IT analytics.
Solutions
IT Analytics
Connect to the technology applications you use every day
Discover Tableau: your new IT partner
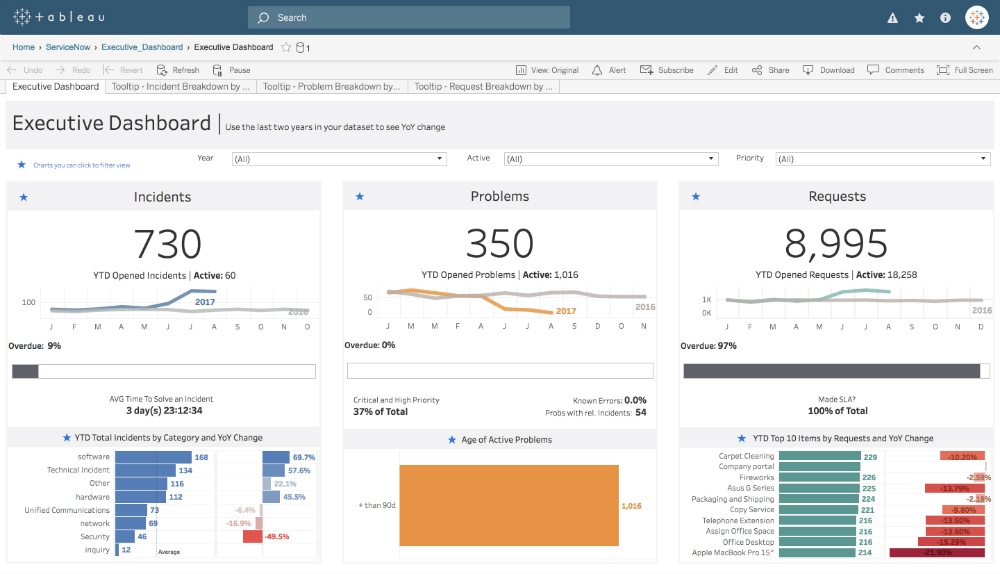
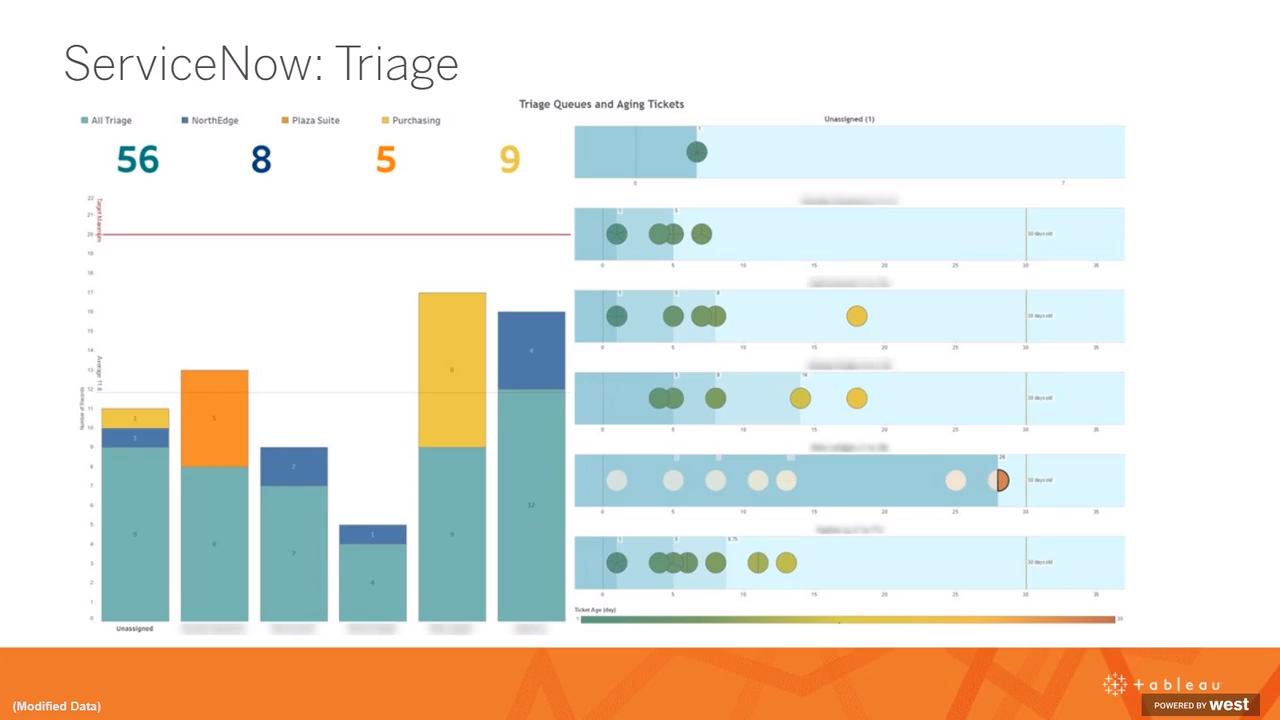
Track tickets
Jumpstart your analysis with actionable data. In just a few clicks, you can connect to ServiceNow to better understand ownership, project status, and opportunity for improvement. Interact with your dashboard to see the status of a case on any given day.
Ready to try our Dashboard Starters on your own data?
Get the starter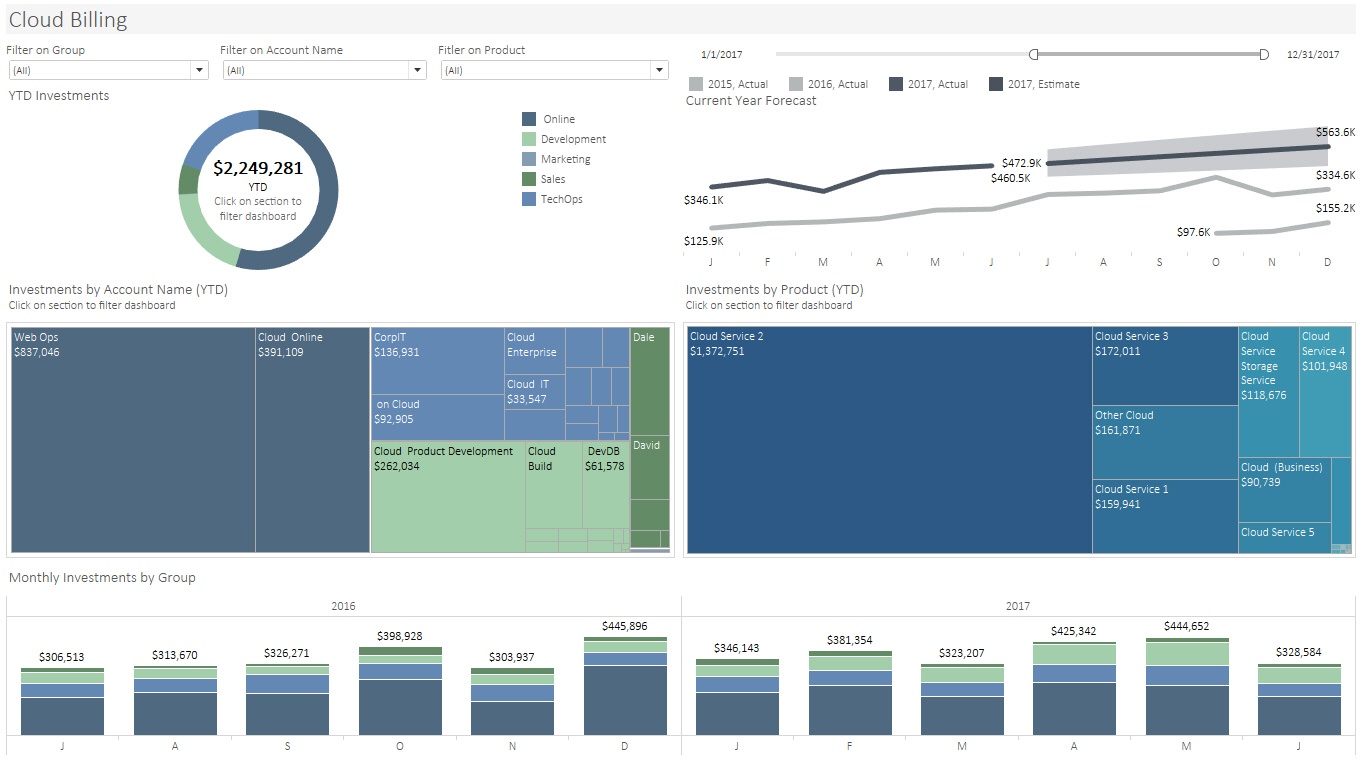
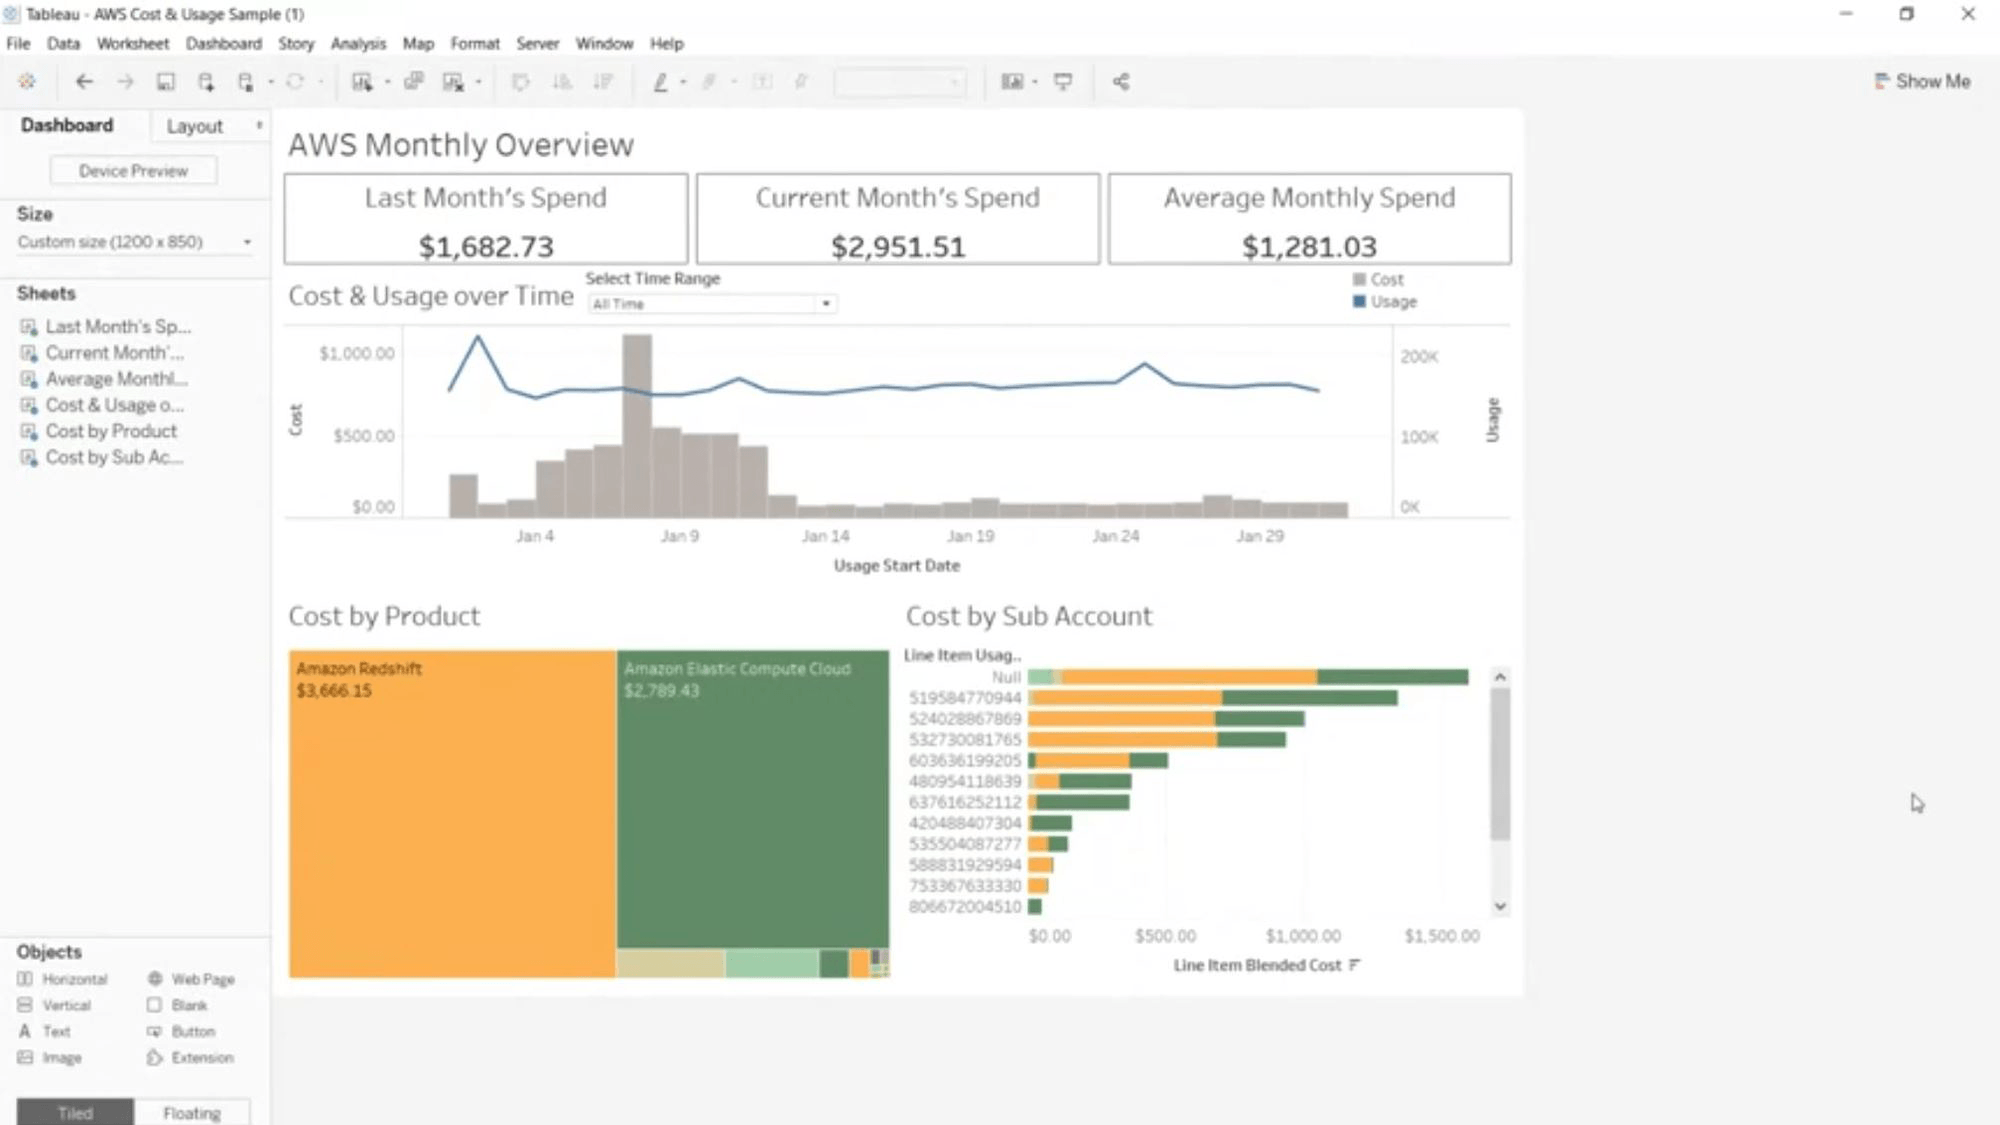
Analyze Cloud Spend
Aggregate Cloud billing data from multiple vendors into a single dashboard to better understand costs for your organizations and within departments.
Explore the dashboard
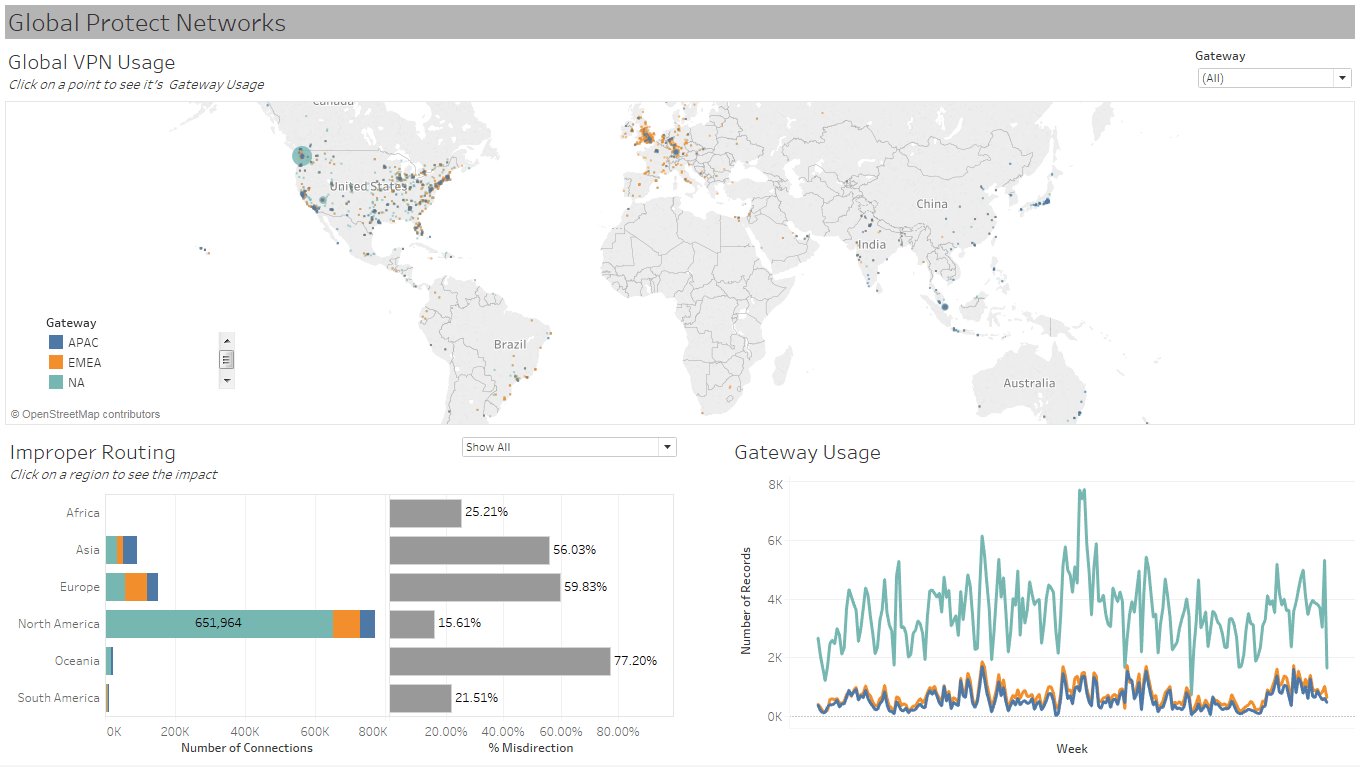
Monitor utilization
It's important to know what systems are up—and if they’re nearing capacity—at any given moment. Data driven alerts on Tableau Server notify you when your data is at a given threshold, allowing you to get ahead of system outages and minimize customer interruptions.
Explore the Dashboard
Visualize your IT applications
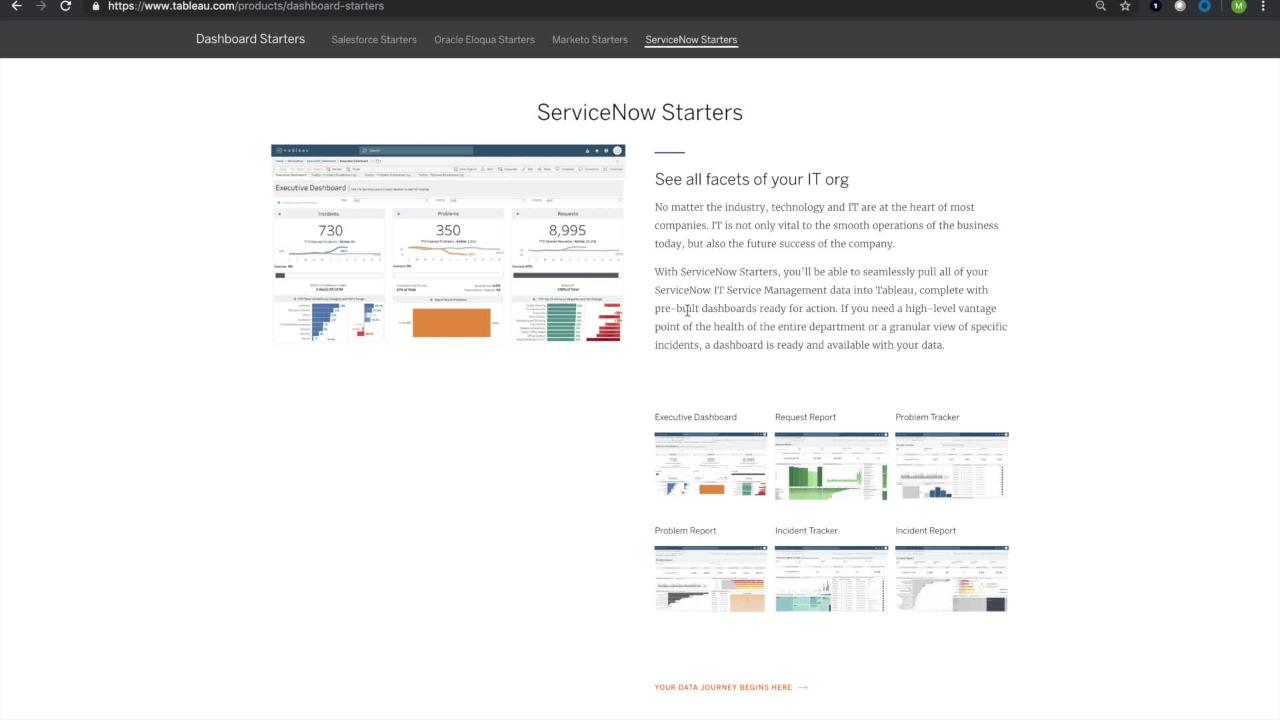
ServiceNow
Analyze incidents, requests and trends with a native connection to Tableau.
Watch the demoDeploy across the enterprise
The decisions you make around governed self-service analytics reach beyond your department. You establish the technological framework that makes your entire organization’s data analytics accessible, agile, and trustworthy - without compromising security and governance.
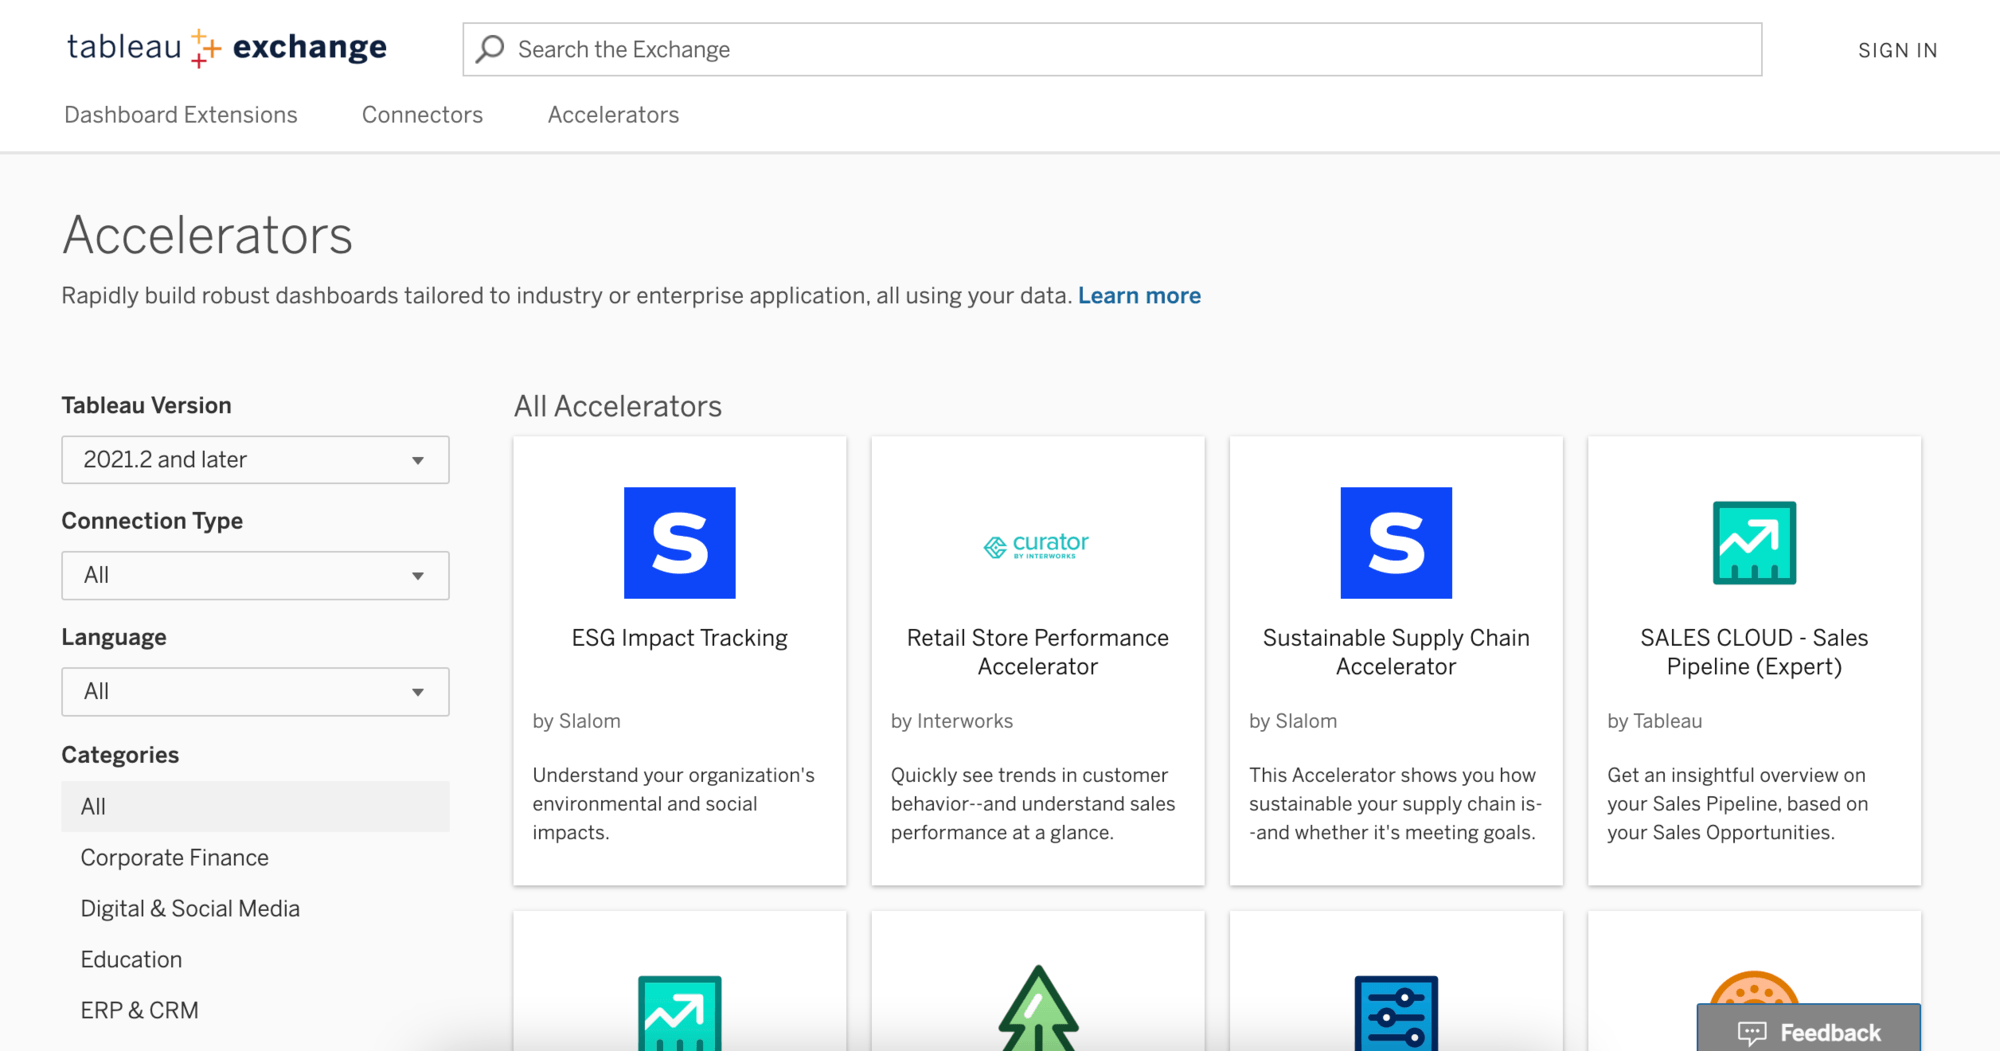
Jump start analysis with Tableau Accelerators
Get expert-built dashboards to address IT Analytics specific business needs with Accelerators on the Tableau Exchange.

Building a Culture of Self-Service Analytics
Learn how to make data analytics a part of everyone's job at your company.
Things like helpdesk usage statistics, user analytics from our web portal, an analysis of classroom usage, and a look at a computer lab’s student use metrics to help decide a facilities question. You name it; we've written a Tableau report that pulls it in.