
Tableau enables real.digital to bring data based decision-making to every workplace
Time savings of 60 - 90 minutes per day
Independence of centralized report creation
Provision of new insights in business contexts
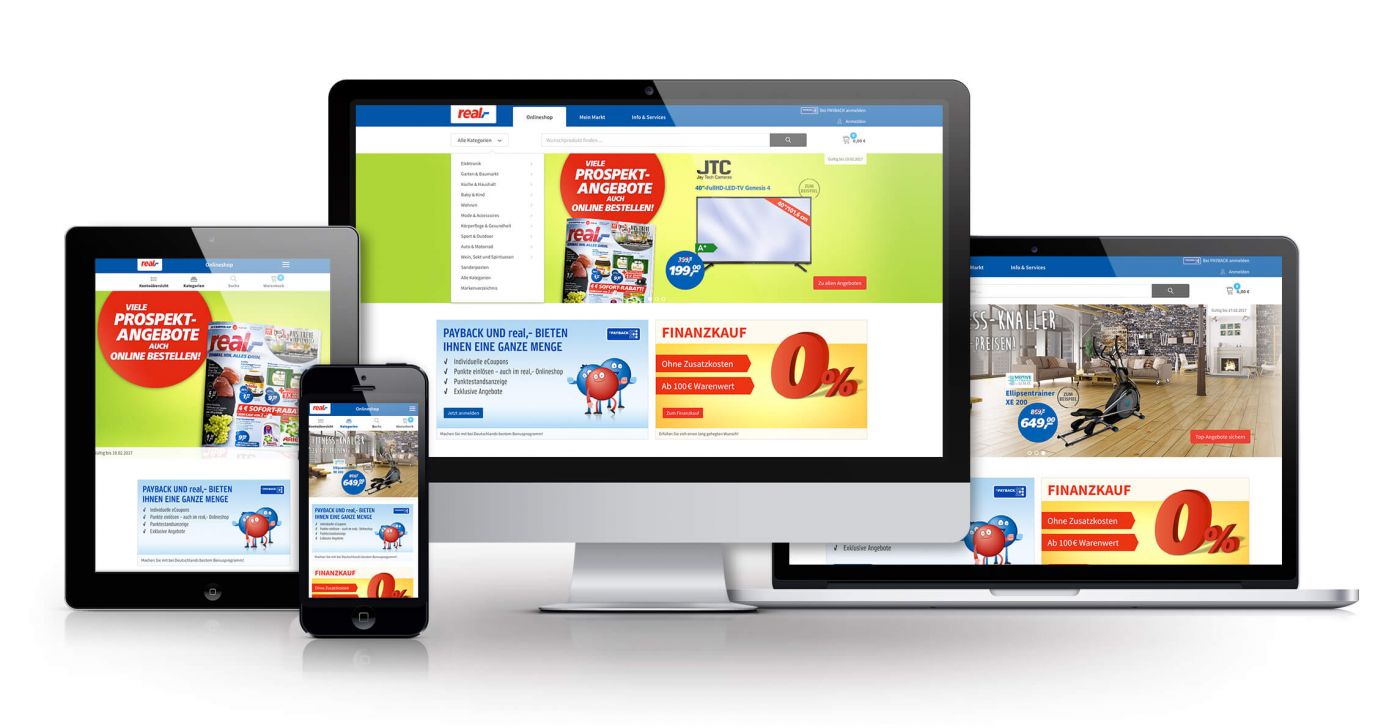
real.digital operates “real.de”, one of the biggest marketplaces in Germany with more than 5,000 merchants offering over 15 million products.
When the statistical company reporting based on SQL requests and spreadsheets reached a limit because of the vast amounts of data, in November, 2018 the management of real.digital initiated a company-wide roll out of Tableau as a universal reporting tool. The purpose was to increase the profitability of the company, to address additional growth and to streamline internal processes.
Today executives in all departments from marketing to the product divisions to customer service rely on Tableau for a variety of uses, and sometimes provide their dashboards to external partners, like call centers.

Tableau self-service reporting for the entire team of real.digital
In the past, central business reporting was accomplished mainly via a stationary, daily updated website showing a list of metrics based on SQL queries. Such internal departmental analyses based on Excel were reaching a limit due to the growing amount of data. “Such a meager offer of analytics will in the long run be insufficient if the goal is to be successful on the scale of Amazon,” explains Richard Hondrich. Therefore, the company in fall 2018 made the decision to roll out a company-wide analysis tool with ease of use and the option to be used largely independently in the company divisions. An assessment phase was initiated, with groups of 10 users evaluating four different reporting tools available on the market, for a maximum of two weeks. Selection criteria were data connection, usability, user ranking and value for money.
“The winner of this evaluation was Tableau,” reports Richard Hondrich. “So we simply purchased one Tableau Server and 100 Tableau Creator licenses and equipped all associates in key positions in the company with them. To help colleagues clear the first hurdles of use, we additionally acquired a contingent of introductory trainings from a realization service provider as an ‘enablement approach’ and implemented them.”
Time savings of 60 - 90 minutes per day in customer service
Subsequently the divisions very quickly started producing a variety of visualizations using Tableau. “Our employees adopted the new tool generally in a very positive way,” reports Richard Hondrich. “After a short period of time we already had requests from users for additional training offers or about specialized topics like restrictions of the analyzed data set or live connections.”


Since completion of the corresponding Tableau dashboard this daily effort of 60 - 90 minutes is moot and the data is always current for the day.
A usage case of particular interest occurred in the area of customer service. In the past a spreadsheet with 440 million rows and a total size of about 800 GB had to be analyzed by complex SQL requests to gather the daily performance report on customer satisfaction, number of open requests, frequency of complaints, duration of calls, processing times, etc. The results were then transferred into a Google Sheet or Excel and for the report into PowerPoint. The daily investment of time amounted to 60 - 90 minutes and the report was prone to error because some processes were done manually.
“Since completion of the corresponding Tableau dashboard this daily effort of 60 - 90 minutes is moot and the data is always current for the day,” explains Richard Hondrich.
Standardizing and professionalizing for the new analysis practices
“We are intensifying the training of particular Tableau users and deploy them targeted in all divisions,” reports Richard Hondrich. “These users will act as ‘Tableau lighthouses’ on-site and professionalize the work of their colleagues. Besides this, we’re working on company-wide standards and best practices in the area of data engineering and are available for extended support requests. Additionally there is an ongoing homogenizing and cleaning of our databases which mainly come together in our Google BigQuery data warehouse, on top of which Tableau exists as a layer of visualizing and analysis.”
Users who until now may have been rather passive consumers of reports ponder the source data and their suitability for particular analyses more and more. Interest regarding their creation and significance is rising greatly.

As Tableau is used in the divisions more and more, there is a change of opinion in the company, according to Richard Hondrich:
“Users who until now may have been rather passive consumers of reports ponder the source data and their suitability for particular analyses more and more. Interest regarding their creation and significance is rising greatly. In the beginning, some users try to use Tableau like a spreadsheet program, just out of habit; more information and education will indubitably be useful here.”
Overall, Richard Hondrich perceives the company as heading in the right direction with Tableau: “There sure is still a lot of work to do to fully exploit Tableau’s enormous potential for use at all workplaces in the company. However, the first successes prove us right and reinforce our belief that it was the correct decision to equip our employees with all the opportunities for self service reporting.”