Measuring Customer Satisfaction
Many businesses have survey data somewhere, waiting for better analysis. Using a survey containing ratings from 1 to 10, this analytical view correlates ratings of overall satisfaction, firm expertise, and likelihood to recommend for several customer segments. Each circle represents a segment defined by the combination of industry, job function, gender, and product. Size corresponds to the number of customers in that segment.

Create and share on Tableau Public
Join the newsletter and find daily inspiration with the Viz of the Day. Yours could be featured next!
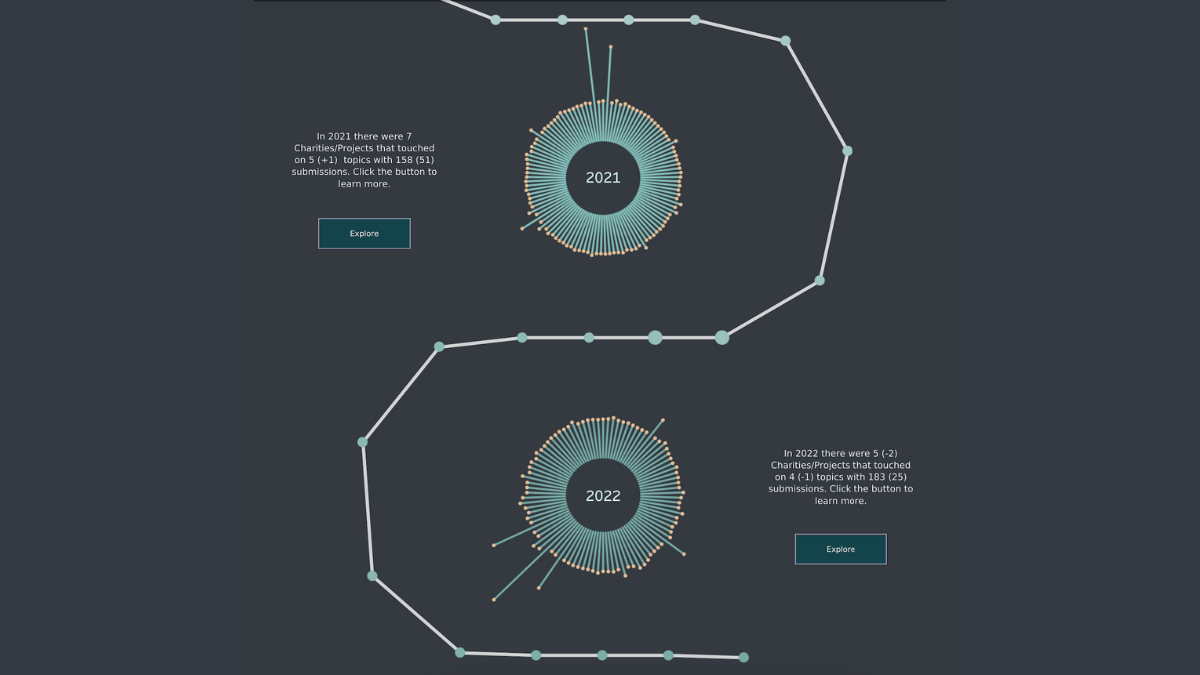
Volunteer Impact
A visual journey of the impact of community-led project #VizforSocialGood. This #VizOfTheDay by Tabitha Diaz highlights the work and projects visualized by over 700 volunteers throughout the years.
Interact with the viz